At present, most of China's large-scale photovoltaic power plants are located in the northwest region, and the northwest region is also a relatively serious dust storm region in China. This also means that the northwest region is an area where China has a relatively heavy dustfall. The impact of dust on the power generation of photovoltaic power plants has not yet attracted the attention of researchers in China, because the rapid development of photovoltaic power plants in China only started in 2009.
The effect of dust on the power generation of the power plant directly determines the investor’s return on investment. In contrast, foreign researchers have done a lot of work in this area. They have done research on the principle of dust's impact on power generation and many factors. Our general workers, especially those engaged in power station design and management The most important thing for the personnel is the specific value of the power generated by the dust reduction photovoltaic power plant. The author has collected some articles published by foreign scholars and extracted some data from it, hoping to give you a reference.
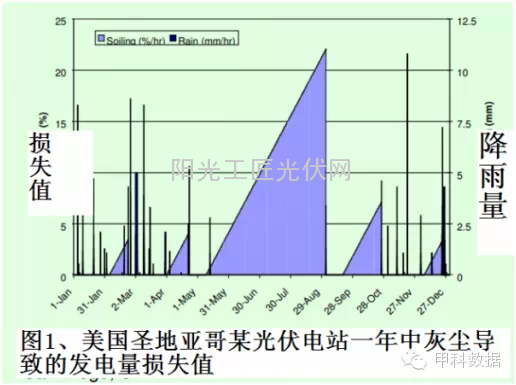
Figure 1 shows the loss rate of power generated by dust from a photovoltaic power plant in San Diego, USA. During the period from May 15 to August 29 without rainfall, the loss rate of power generated by the photovoltaic power plant has been increasing. At 22%, it also means that about 22% of the electricity generated on August 29 was lost due to dust reduction. While there are sporadic rainfalls at other times, the loss rate of dustfall is very small. The city of San Diego has a tropical desert climate; annual precipitation is 240 mm.

Figure 2 shows the loss of power generated by a dustfall at a power station in Cyprus located on the east coast of the Mediterranean Sea near the desert in Western Asia. It can be seen from the figure that regardless of whether the monocrystalline silicon component, the polysilicon component, or the amorphous silicon component is disposed with time outside, the more dust is dropped, the stronger the weakening effect on the power generation, and the amorphous silicon is affected. The impact is relatively small relative to the other two. After the drought lasted for 14 weeks, the loss rate of single crystal and polycrystalline power generation reached about 14%.
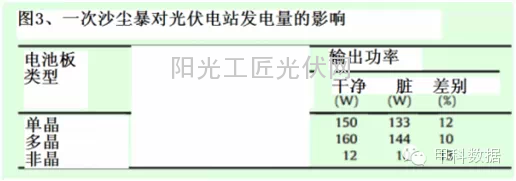
Figure 3 shows the power loss value of a panel measured after a dust storm in a power station in Cyprus. Visible losses are still quite large, all over 10%. Therefore, it is recommended that the power station cleans the panels after each sandstorm. Cyprus is a Mediterranean climate with an average annual rainfall of 480mm.

Figure 4 shows the annual dust reduction rate of photovoltaic power stations in different regions of the United States. It also subdivides the rural, suburban and city/airport/high-speed roadside communities. In most cities, the urban dust reduction losses are higher than in the other two regions. The two regions on the far right belong to the desert climate. The difference between the three is not significant. The annual loss rate is about 4%. In fact, the loss of dust from large-scale photovoltaic power plants is higher than the values ​​in the four figures above, because the values ​​are all measured at the test stations, and they are all installed on the roof of the building, and the amount of dust is with the ground. The height is declining, so if the panel is installed on the ground, the dust loss rate is greater.
The western region of China is also the birthplace of sandstorms in Asia. The dustfall is higher than that in the above map. The large-scale power stations in our country are all installed in Gobi or deserts and have little vegetation. Therefore, the dustfall loss rate is conservatively estimated at more than 5%. The 25-year total dust reduction of a ten megawatt photovoltaic power station is approximately 1.3 degrees/year/watt*10 megawatts (power station scale)*25 years (working years)*0.9 yuan/degree (on-grid power price)*5% (The efficiency of dustfall loss) = 1,4625,000 yuan, which is approximately 14.62 million yuan. This number is still very large. Therefore, it is recommended that the management staff of photovoltaic power plants can increase the importance attached to the dustfall loss rate and do regular cleaning work.
It is unscientific to give a definite value for the interval between cleanings, because the situation in each area is different, the situation is different in each area in a month, the situation in each month is different every year, and the traditional cleaning method is expensive. The need to set a critical point, AB data monitoring software real-time monitoring of real-time power generation and theoretical power generation, set up warning of critical points for cleaning, to help users control cleaning costs, improve power generation efficiency.
Swaco MD-2 Shaker Screen/MD-3 Shaker Screen
Replacement Screens for M-I SWACO MD-2 & MD-3 Shakers
SJ-Swaco MD-2/3 shaker screen is a kind of composite frame shaker screen specified for both M-I SWACO MD-2 dual flat-deck shaker and MD-3 triple-decker shale shaker. M-I SWACO MD-2 shale shaker is suitable for both onshore and offshore applications and MD-3 triple-decker shale shaker mainly targets primarily high-end offshore operations. Reinforced PT frame reduces the friction between the screen and deck plate. Featured by higher throughput, extended screen life, fewer replacements, our screens aim to lower the cost of mud treatment.
Technical Parameter
- Mesh Material: stainless steel 304/316/316 L.
- Frame Material: PT.
- Screen Type: XR.
- API RP 13C Designation: API 20 – API 325.
- Package: packed in paper carton, shipped by wooden case
Adaptable Shale Shaker Model
SJ-Swaco MD-2/3 shaker screens are used as the substitute screen for
- M-I SWACO MD-2 dual flat-deck shale shaker.
- M-I SWACO MD-3 triple-decker shale shaker.
Competitive Advantage
- Composite screen technology increases effective open area.
- Improves process capacity and maximizes screen life.
- Pre-tensioned screens with light weight for easier handling
- Manufactured according to the API RP 13C (ISO 13501).
- Scientific & reasonable cost control system for competitive price.
- Adequate inventory in the shortest time to meet customers' demand.


Remarks:
M-I SWACO, MD-2, MD-3 are marks of M-I L.L.C.
ShengJia only produces the replacement screens but not original from M-I SWACO


Swaco Md-2 Shaker Screen,Swaco Md-2 Shale Shaker Screen,Shaker Screen,Swaco Shakers
Anping Shengjia Hardware Mesh Co.,ltd , https://www.oilshakerscreen.com